tmplot
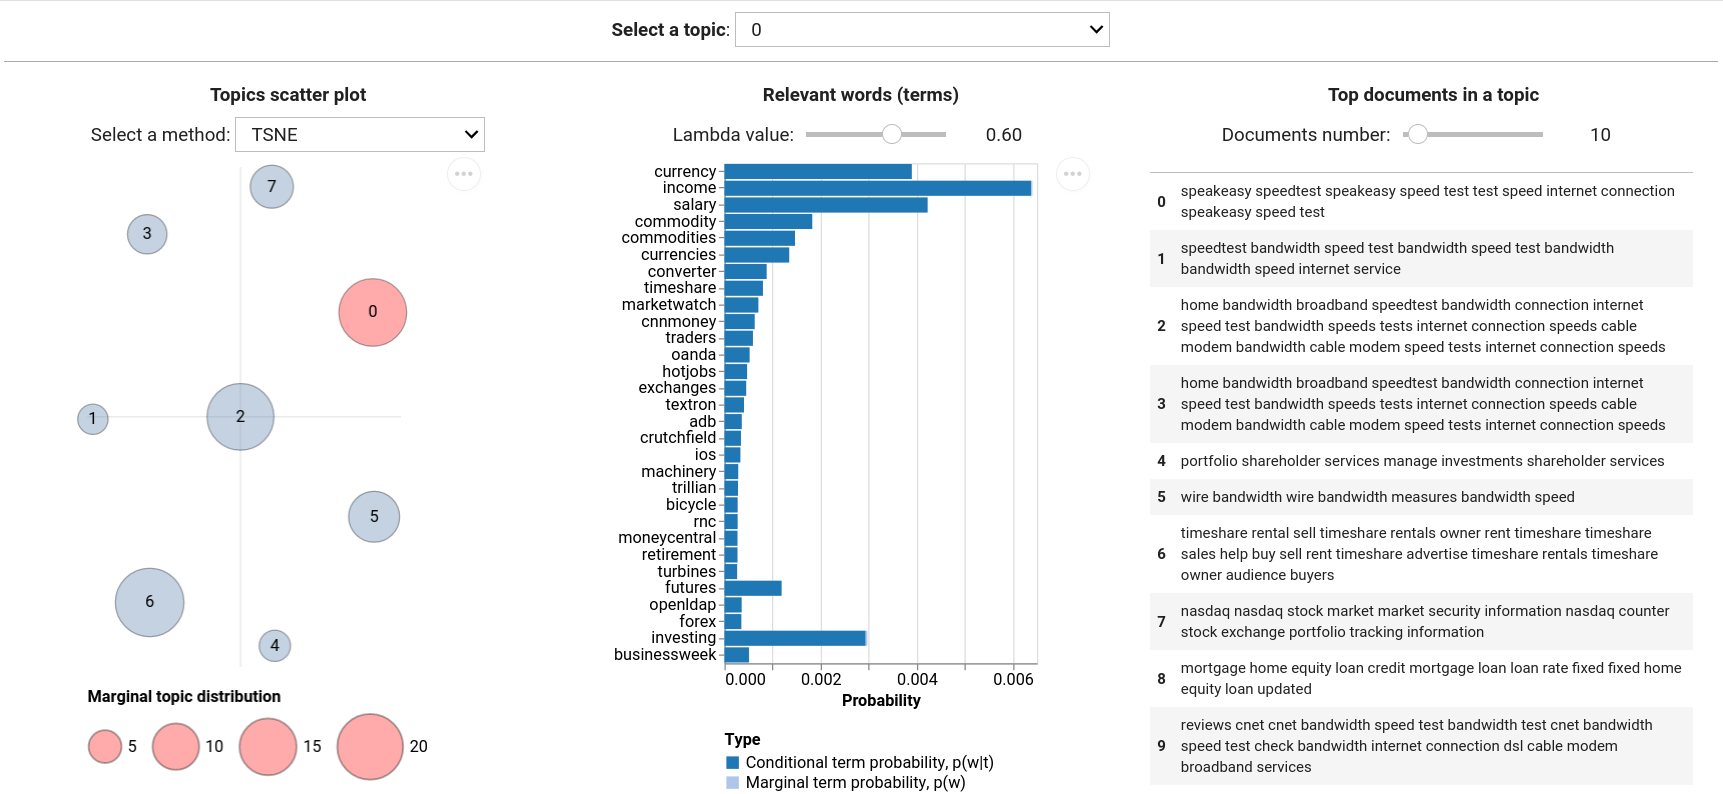
tmplot is a Python package for visualizing topic modeling results. It provides the interactive report interface that borrows much from LDAvis/pyLDAvis and builds upon it offering a number of metrics for calculating topics distances and a number of algorithms for calculating scatter coordinates of topics.
Features
Supported models:
tomotopy:
LDAModel,LLDAModel,CTModel,DMRModel,HDPModel,PTModel,SLDAModel,GDMRModelgensim:
LdaModel,LdaMulticorebitermplus:
BTM
Supported distance metrics:
Kullback-Leibler (symmetric and non-symmetric) divergence
Jenson-Shannon divergence
Jeffrey’s divergence
Hellinger distance
Bhattacharyya distance
Total variation distance
Jaccard inversed index
Supported algorithms for calculating topics scatter coordinates:
t-SNE
SpectralEmbedding
MDS
LocallyLinearEmbedding
Isomap